Published: 2024-04-25T13:11:28.000Z
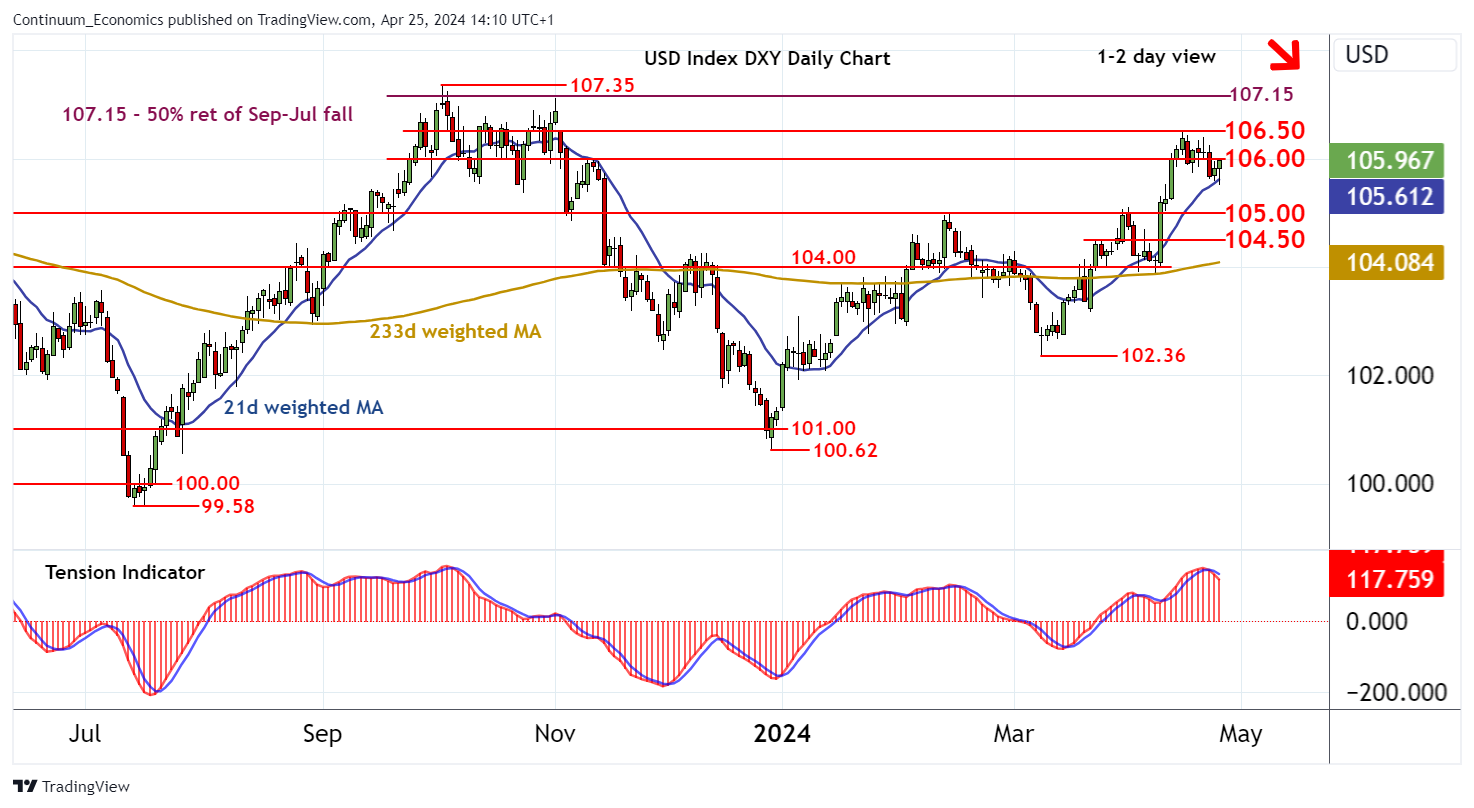
Chart USD Index DXY Update: Limited scope above 106.00

Senior Technical Strategist
-
Cautious trade has given way to a bounce
| Levels | Imp | Comment | Levels | Imp | Comment | |||
|---|---|---|---|---|---|---|---|---|
| R4 | 107.35 | ** | 3 Oct 2023 (y) high | S1 | 105.50 | intraday low | ||
| R3 | 107.15 | ** | 50% ret of Sep-Jul fall | S2 | 105.00 | ** | break level | |
| R2 | 106.50 | * | congestion | S3 | 104.50 | break level | ||
| R1 | 106.00 | * | congestion | S4 | 104.00 | * | congestion |
Asterisk denotes strength of level
13:55 BST - Cautious trade has given way to a bounce, with prices within reach of congestion resistance at 106.00. Intraday studies have ticked higher, suggesting potential for a test above here. However, daily readings continue to point lower and overbought weekly stochastics are flattening, suggesting risk of fresh selling interest towards 106.50. Following cautious trade, price action is expected to turn lower once again. A later break below the 105.50 current day low will add weight to sentiment and open up support at 105.00. However, the rising weekly Tension Indicator could limit any initial tests of here in fresh consolidation.