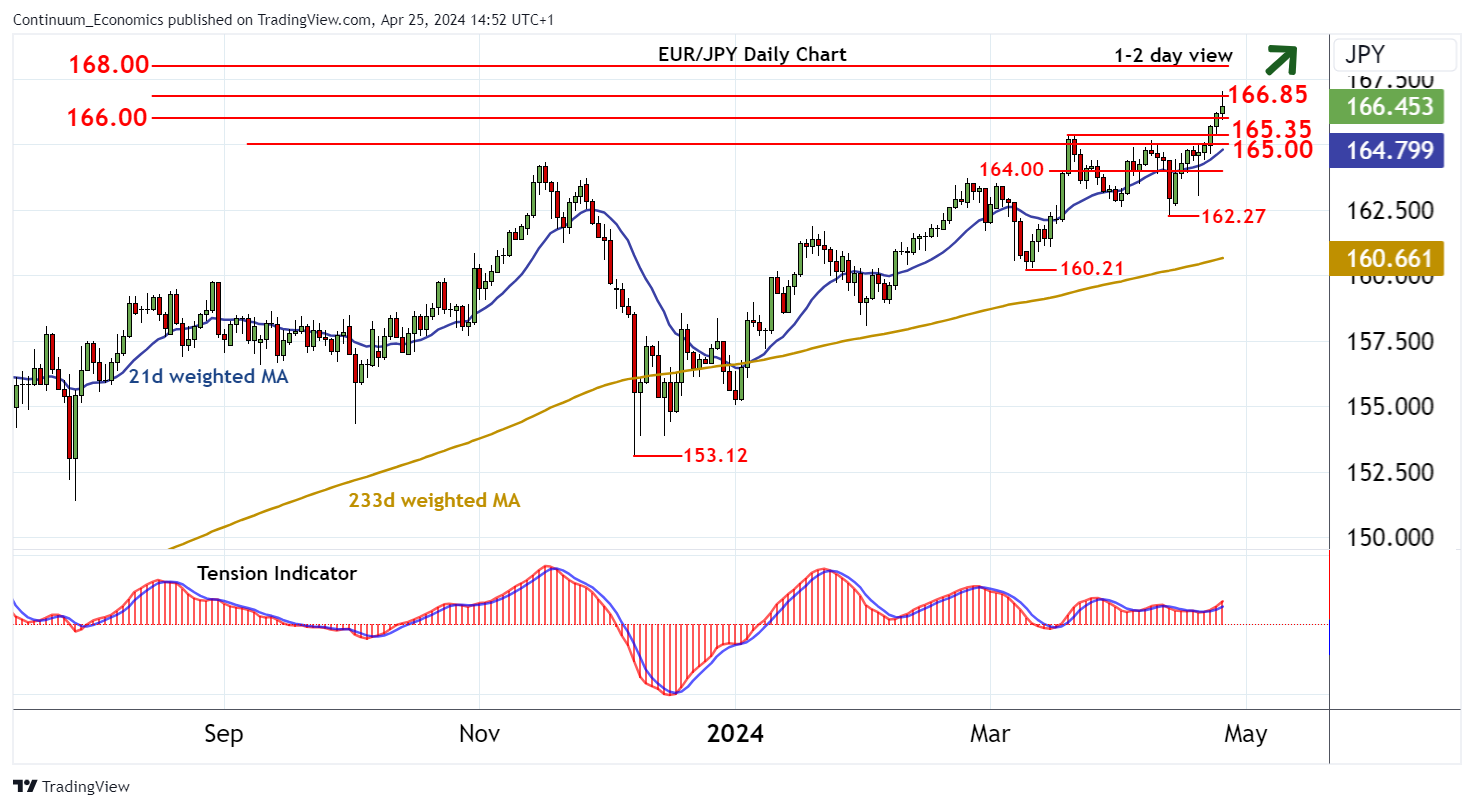
Chart EUR/JPY Update: Balanced at 2008 levels - daily studies trading higher

Anticipated gains have reached the 166.85 low of 5 August 2008
| Levels | Imp | Comment | Levels | Imp | Comment | |||
|---|---|---|---|---|---|---|---|---|
| R4 | 169.97 | ** | July 2008 multi-year high | S1 | 165.35/00 | * | Mar high, congestion | |
| R3 | 169.45 | * | 7 Aug 2008 high | S2 | 164.30 | * | Nov high | |
| R2 | 168.00 | * | congestion | S3 | 163.70 | * | Feb high | |
| R1 | 166.85 | * | 5 Aug 2008 low | S4 | 163.00 | figure |
Asterisk denotes strength of level
14:40 BST - Anticipated gains have reached the 166.85 low of 5 August 2008, where unwinding overbought intraday studies are prompting a sharp pullback and fresh consolidation above 166.00. Daily readings continue to rise, suggesting potential for a fresh test above 166.85. However, overbought daily stochastics and mixed weekly charts are expected to limit initial scope in profit-taking towards 168.00. Meanwhile, a break below 166.00 will open up strong support at the 165.35 monthly high of 20 March and congestion around 165.00. A close beneath here is needed to turn sentiment outright negative and confirm a near-term top in place, as focus then turns to 164.00.